pfSense -> influxdb metrics collection
# Jan 14 2017 by willUpdate Oct 20, 2017
As pointed out in the comments below, most of this is no longer needed since the official release of the telegraf package for pfSense 2.4 and above.
I'm still leaving it up for posterity.
If any of the pfSense folks read this, some extra configuration options on the settings page for the plugin would be nice to see; but otherwise works like a charm.
If you’re like me, a sexy looking dashboard is a difficult thing to look away from. Time-series data, when properly formatted on a graph is just so appealing:
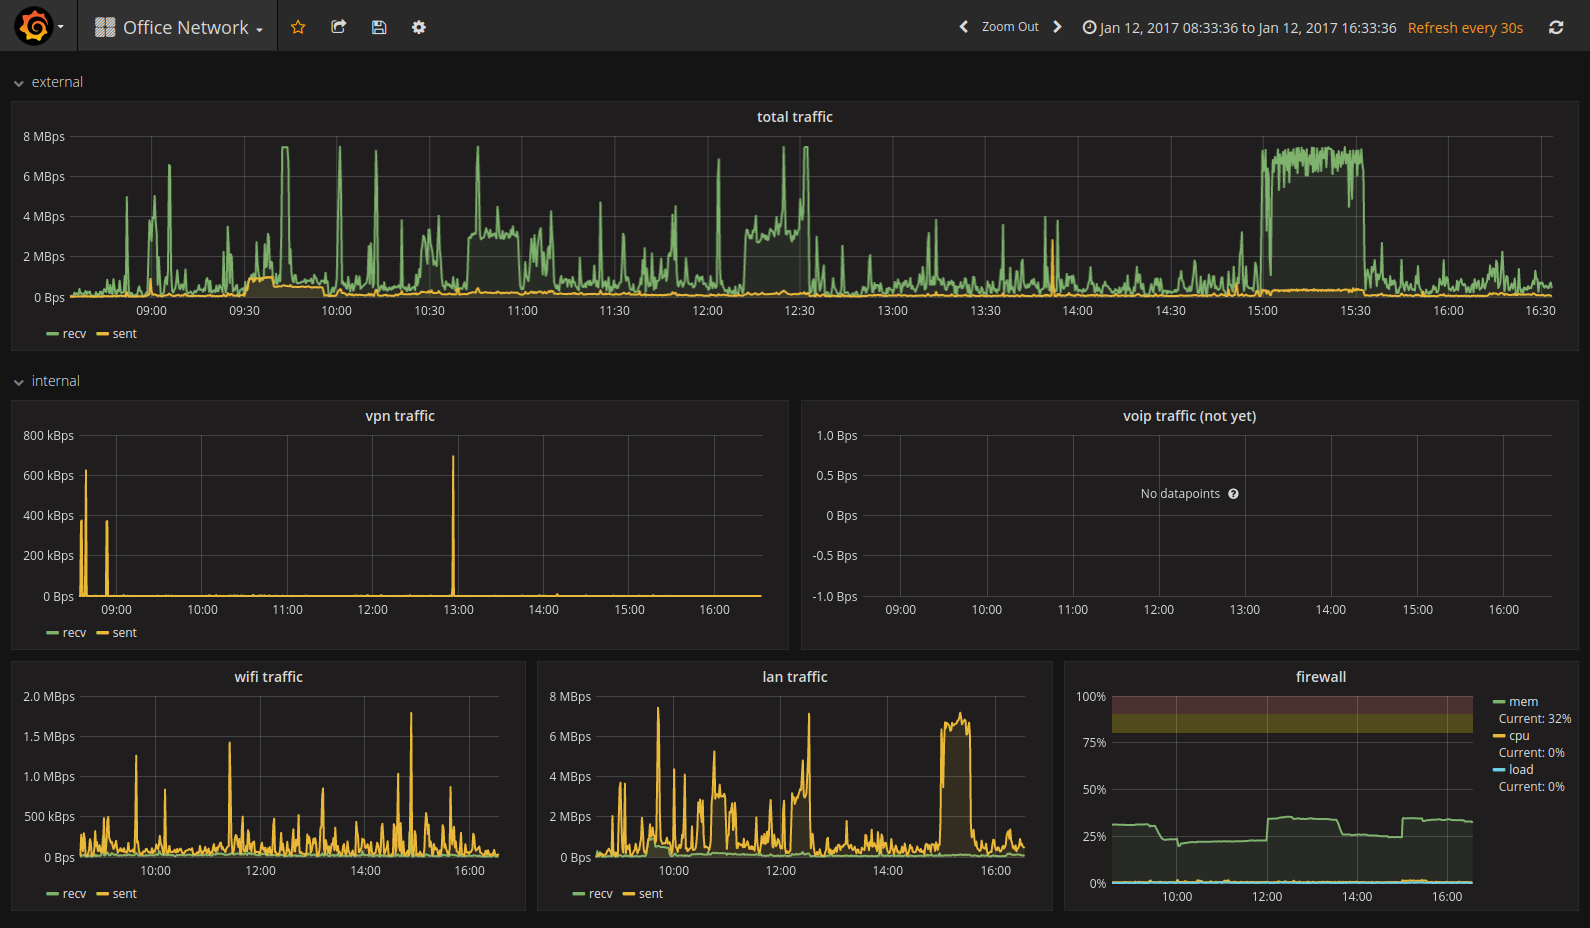
If that doesn’t get your data collection juices flowing, then something’s just wrong with you. Seriously. You should get that checked out. Go, make an appointment. I’ll wait.
Now that you’re back, making this work with pfSense wasn’t nearly as complicated as I expected it would be. There’s not an official pfSense package for the collector agent, but there is one for the underlying FreeBSD. The fine folks at InfluxData have made it really easy to collect data points from all kinds of systems, be they Linux, Windows, BSD, etc and send it to an almost as easily setup InfluxDB host for collection and query. There’s tons of articles online about setting up Influx / Grafana, so I’ll leave that up to the readers’ individual Google-Fu and / or the comments to find good guides to that. If there’s interest then maybe I’ll write up a little something on it later.
As far as setting up the collector for pfSense, it really couldn’t be simpler. All you need is a root shell on your pfSense device, and this line:
pkg add http://pkg.freebsd.org/freebsd:10:x86:64/latest/All/telegraf-1.1.2.txz
There doesn’t seem to be a 32bit version in the pkg repos, ’cause why would there be? This is the version at the time of writing, look to the repo for the current URL.
After it’s installed, there’s just a couple of things to do that are a little different from regular BSD to configure, enable, and start the Telegraf service and start sending those sweet, sweet datagrams.
/usr/local/etc/telegraf.conf is where the whole collector is configured. There’s two main sections, input and output. The output section is where you configure the InfluxDB (or whatever else) you’d like to send metrics to, and the input section is where you configure the various things you’d like the collector to, well, collect.
Output(s)
The output(s) can talk to a lot of different systems, but since I’m talking about InfluxDB here, the section we’re concerned with is [[outputs.influxdb]]. It’s just a matter of setting the URL(s) of the InfluxDB(s) you want your metrics sent to, along with associated logins for said DBs if applicable:
[[outputs.influxdb]]
  urls = ["http://10.10.0.15:8089"]
  ...
  database = "telegraf"
  ...
  username = "obscureusername"
  password = "securepassword"
Inputs
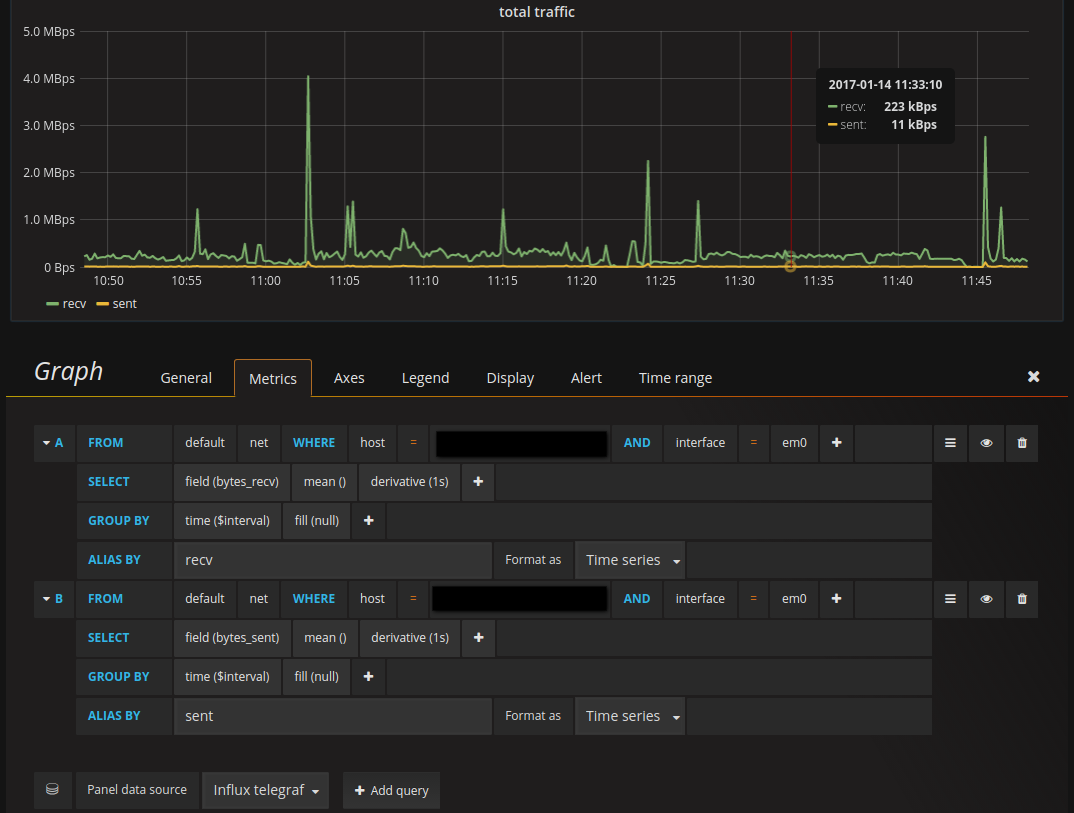
As far as inputs, out of the box it’s already set to collect things like memory, disk, cpu usage etc, but for some reason the network stats collector is commented out. It’s pretty trivial to enable it, though; just un-comment the line [[inputs.net]]. While you’re in there, check out the other collectors it has, it can pull in lots of different things that might be of interest to you.
After all that difficult config work, it’s just as simple as enabling the service to auto-start:
echo "telegraf_enable=YES" >> /etc/rc.conf
and starting it:
/usr/local/etc/rc.d/telegraf start
Now just go to either your InfluxDB Admin page or your dashboard and start using the collected metrics in your shiny dashboards to impress the corner office dwellers during the next status meeting: