Defaults, don't accept them.
# May 5 2017 by willBuilding out an InfluxDB host for metrics collection is pretty straightforward, even piping things into it from various sources isn’t difficult, thanks to the multitude of plugins available out of the box, including some very handy SNMP gathering that I’ll likely go into later when the mood strikes and I have more time. I did exactly this at the day gig not long ago to replace the bulky, somewhat cumbersome check_mk based monitoring I initially set up when I started here (they had nothing in place, except for a few broken zabbix clients, no collection point).
I did what most (overly?) busy admins do, and just accepted the defaults to begin with since I knew our usage would be fairly small; a mid-size software company that builds primarily on-prem things doesn’t have just a ton of infrastructure to worry about. This did kind-of end up biting me, though not in a bad way. Those of you that have to deal with systems monitoring probably know that the false alarm is one of the worst annoyances possible. And this was exactly what was happening, every night between midnight and 4am; “no data” false alarms on every configured alert, randomly but always inside that time window.
It got annoying enough to finally look into it after about a week or so, and what I found was a little odd, and kind-of technical to the inner workings of InfluxDB, so here we go…
Influx keeps the actual data stored in a particular database in chunky BLOB files called “shards” that are split apart based on the duration of time defined in a retention policy as SHARD DURATION. My understanding of this is that data points collected from a contiguous time period will all be stored together in a file, and at the end of the SHARD DURATION a new file will be created and added to the “shard group” for that database. How long the files in these “shard groups” are kept is defined by the overall retention policy DURATION.
That all might sound confusing, but it’s important to remember. Now, as part of a default setup, there are some nightly compaction and cleanup tasks that run on InfluxDB hosts, like you might expect on any database. As you might also expect, the intensity and duration of these tasks varies, depending on how much data you have stored.
What I didn’t expect, was the default auto-generated retention policy to use a setting that seems to be undocumented…
The autogen retention policy on our setup was set to 168h for the SHARD DURATION, but 0s for the overall DURATION; the effect of which is unclear based on the available documentation. The effect on the host system, however, was pretty clear:
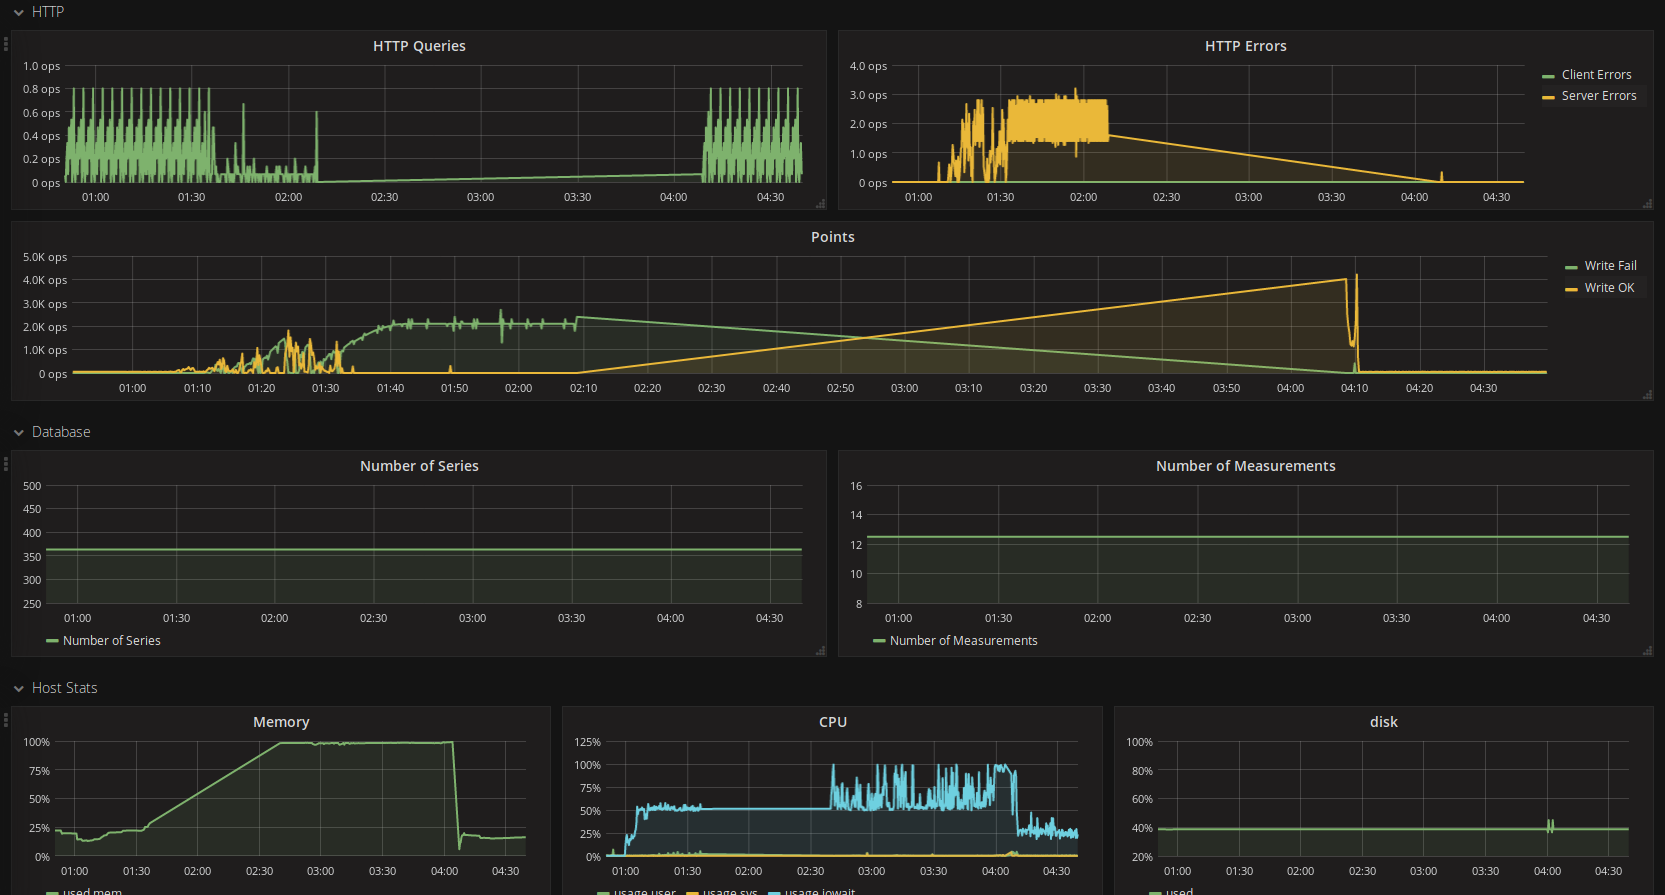
It was churning on these cleanup tasks for ~4h, eating up all available memory and causing the Grafana dashboard to time out when it queried to run the alert checks, hence the false alarms. The solution was modifying the ‘autogen’ policy to have a meaningful DURATION, in our case we went with 4320h. Since feeding the Influx Admin Interface that one line, ALTER RETENTION POLICY autogen ON <db_name> DURATION 4320h we’ve not had a single false alarm during the nightly compaction jobs, and the memory usage has stayed steady despite the obvious CPU increase for the tasks staying about the same as pictured above.
So the TL;DR of the whole thing here is, don’t trust the default policies on database type things, at least not 100% of the time.